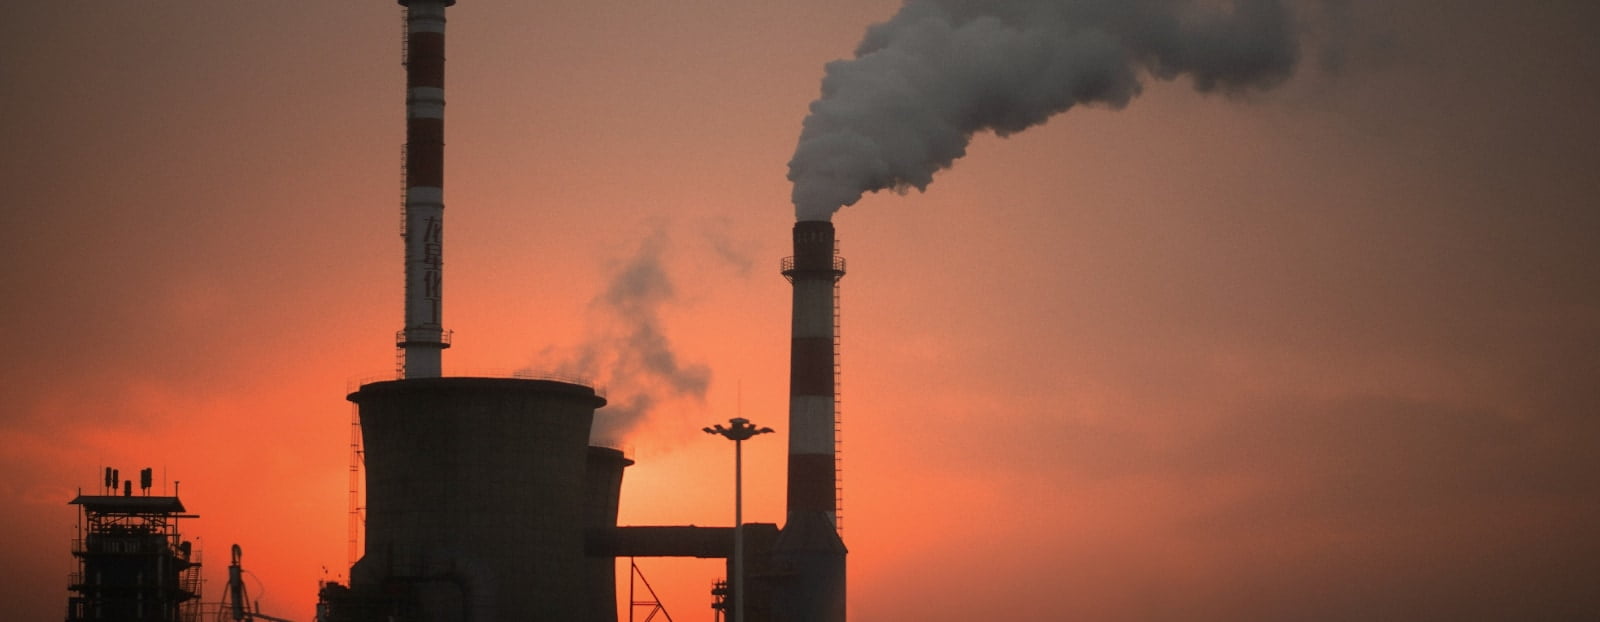
Over the last decade, Fossil Fuel giants donated over $13.7 million to the Labor and Liberal/National parties.

Over the last decade the major parties took over $13.7 million from the coal, oil and gas industry
| cat_id | Industry segment | hide | Liberal/National | Labor | Total |
|---|---|---|---|---|---|
| 71 | Oil and Gas | 0 | 3,644,726 | 3,764,454 | 7,409,180 |
| 68 | Coal | 0 | 2,551,208 | 1,474,403 | 4,025,611 |
| 72 | Coal - Oil - Gas | 0 | 1,264,667 | 710,492 | 1,975,159 |
| 70 | Gas and CSG | 0 | 194,004 | 274,490 | 468,494 |
| 69 | Coal and Gas | 0 | 687,384 | 562,358 | 1,249,742 |
| 10 | Fossil Fuel Industry | 0 | 2,000 | 2,000 | |
| ∑ = 8,341,989 | ∑ = 6,788,197 | ∑ = 15,130,186 |
Table: donations made from companies associated with fossil fuels made to the Labor and Liberal/National parties made 1/7/2012–30/6/2022.
The Top 6 donors:
Woodside Energy
Includes: Oil and Gas | Wesfarmers Limited
Includes: Coal | Santos Limited
Includes: Coal |
Chevron Australia
Includes: Oil and Gas | Minerals Council of Australia
Includes: Coal, Oil & Gas | Origin Energy
Includes: Coal and Gas |
It’s no surprise that the major parties don’t have a plan to transition away from polluting fossil fuel industries like coal.
All donations from fossil fuel companies FY2013-FY2022
| Company | Fossil Fuel interest | LNP | Labor | Total | ||
|---|---|---|---|---|---|---|
| Company | Fossil Fuel interest | LNP | Active between | Labor | Active between | Total |
| Woodside Energy Limited | Oil and Gas | 1,206,970 | FY2013–FY2022 | 1,185,150 | FY2013–FY2023 | 2,392,120 |
| Wesfarmers Limited | Coal | 1,027,060 | FY2013–FY2023 | 755,500 | FY2014–FY2023 | 1,782,560 |
| Santos Limited | Oil and Gas | 807,054 | FY2013–FY2023 | 820,919 | FY2013–FY2023 | 1,627,973 |
| Minerals Council of Australia | Coal - Oil - Gas | 462,417 | FY2016–FY2023 | 421,700 | FY2015–FY2023 | 884,117 |
| Chevron Australia Pty Ltd | Oil and Gas | 384,542 | FY2013–FY2022 | 389,128 | FY2013–FY2023 | 773,670 |
| Caltex Australia | Oil and Gas | 320,330 | FY2013–FY2023 | 294,487 | FY2013–FY2023 | 614,817 |
| Origin Energy | Coal and Gas | 309,704 | FY2013–FY2022 | 300,737 | FY2013–FY2023 | 610,441 |
| LET Australia Ltd | Coal | 164,317 | FY2020–FY2023 | 227,600 | FY2020–FY2023 | 391,917 |
| APPEA Limited | Oil and Gas | 69,380 | FY2019–FY2022 | 280,075 | FY2015–FY2023 | 349,455 |
| The Chamber of Minerals & Energy of WA | Coal - Oil - Gas | 118,500 | FY2019–FY2023 | 202,874 | FY2017–FY2023 | 321,374 |
| ∑ = 4,870,274 | ∑ = 4,878,170 | ∑ = 9,748,444 | ||||
| Avg = 487,027.40 | Avg = 487,817.00 | Avg = 974,844.40 | ||||
| Max = 1,206,970 | Max = 1,185,150 | Max = 2,392,120 |

 $1,138,150
 $1,206,970

